Overview
Upon logging in to SOP, plant users will be directed to a list of plants. Users can select the plant they are working at and click the “Job Dashboard” button.
Job Dashboard
The Job Dashboard provides an overview of all current jobs at the plant. Each job is displayed in a panel, showcasing key details and progress. This includes the job number, cost code, and mix, as well as the loaded and paved tons.
In the center of the panel, the job’s target load is displayed. The dark blue outer circle represents the production progress based on the number of loaded trucks and tons. The inner light blue circle represents the progress of unloaded loads and tons from the unloading process.
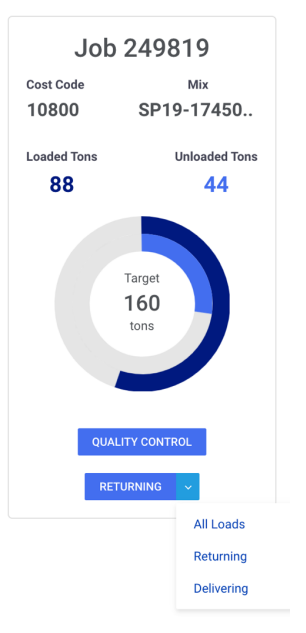
Trucks and Loads
At the bottom of each panel, there are buttons to view the quality control report and access the list of returning trucks and tickets for the job. On the right side of the “Returning” button, additional options are available to view the loads.
From the Loads list, plant users can add quality control records, and notes, and modify load uses.
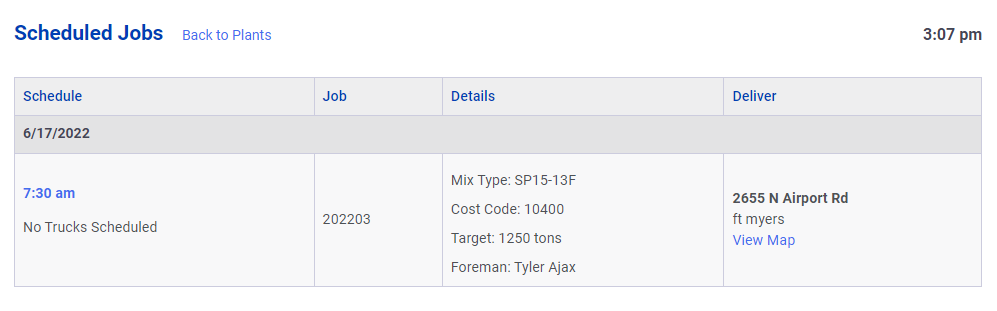
Scheduled Jobs
From the plant’s Job Dashboard, users can click the “Scheduled Jobs” button to view a list of upcoming jobs scheduled for the plant. This list includes outside sales customers who have scheduled jobs.
As jobs begin loading, they will be removed from the Scheduled Jobs list and added to the Job Dashboard panels.
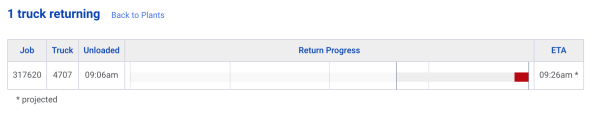
Returning Trucks
From the plant’s Job Dashboard, users can click on the “Returning Trucks” button to view a list of all the trucks that have unloaded and are returning to the plant. Each truck is listed with its corresponding job number, truck number, unload time, ETA, and a progress bar indicating the expected return time. Trucks from multiple jobs will appear in the same list and are sorted by ETA.
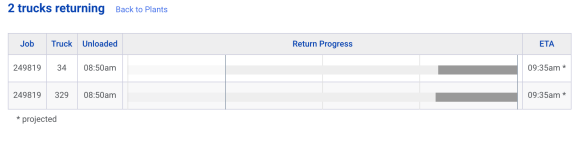
If the returning trucks have not been loaded by their ETA, the progress bars will start to move backward from the right side, indicating a delay from the expected return time.