Overview
After a Plant Manager logs in, SOP will take them to their Dashboard. This screen will give you an overview of the activity at your plants. If you are a Plant Operator, please visit the Plant Dashboard guide.
Note: The information shown here is relative to your selected default plants, to change the available information, please visit the Setting a Default Plant guide.
The Dashboard Graph
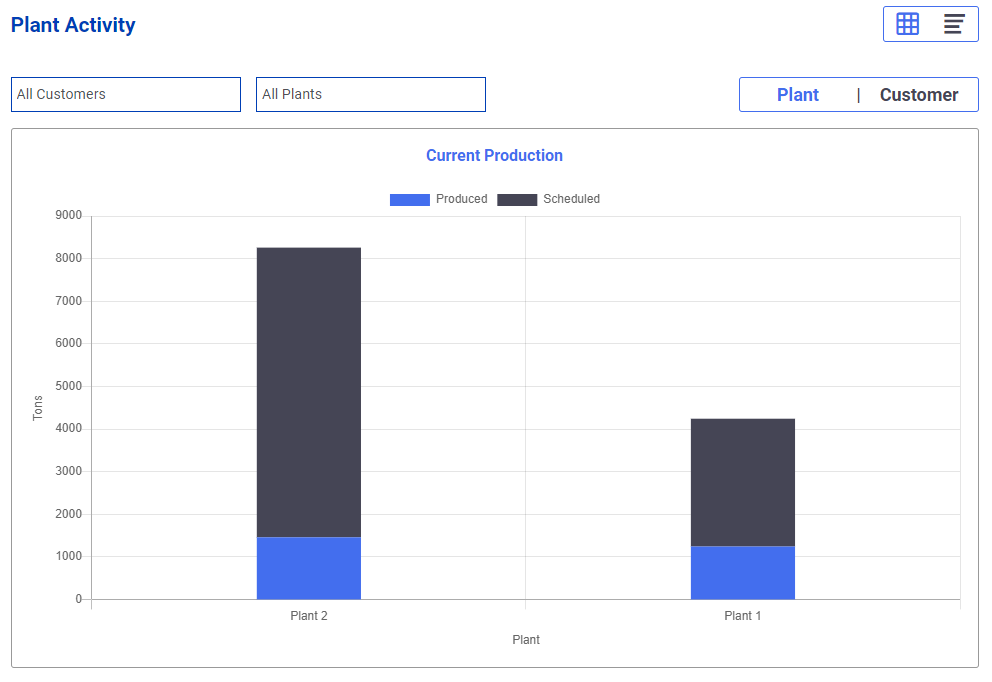
While on the dashboard screen, you’ll be shown a graph that breaks down the volume of tons that are shipping out from each plant. ‘Scheduled’ tons refers the total amount of tons being targeted for production that day, and is shown as the grey bar. ‘Produced’ tons refers to the total amount of tons that have been produced, and loaded out to a job, and is shown as the blue bar.
At any time, you may click the [ Plant | Customer ] toggle to reorganize the graph to be grouped by Plant, or by Customer.
In addition to this, you may use the dropdown menus on the left side of the page to filter the graph by a certain Customer or Plant.
Lastly, by clicking the display located on the top right of the page, you can show the list version of the dashboard.
Note: You can click the graph at any time to automatically swap to the list view, along with filtering the list according to what you click on the graph. Additionally, hover over the graph for an exact total of the tons displayed.
The Dashboard List
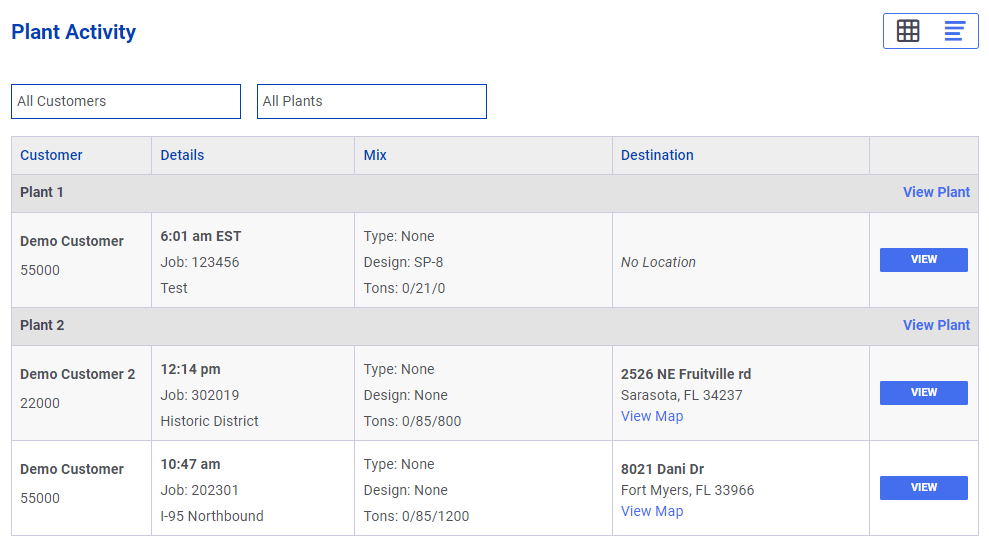
When on the list version of the dashboard, you’ll be shown a breakdown of all active jobs that are current shipping material to customers. Each plant is given their own heading, shown in grey, along with all jobs that are shipping from the plant beneath it. Each shift will have a summarized breakdown of the customer, job number, tonnage, and job locations.
In addition to this, you may use the dropdown menus on the left side of the page to filter the list by a certain Customer or Plant.
Lastly, by clicking the display located on the top right of the page, you can show the graphical version of the dashboard.
Note: You can click the plant heading at any time to view a plant’s individual details by using the ‘View Plant’ button at the right. Visit the Plant Dashboard guide to learn more about this page.
Viewing Jobs
From the dashboard, while in the list view, you can click ‘View’ to access a job for further details such as progress, statistics, and the All Loads list. For more information on viewing, editing, and creating jobs, visit the Order Management guides section.


